
Refreshing scores and recalculating data for sharper and market intelligence

StocksRunner.com — your trusted companion for smarter stock market decisions.
Find us on





Disclaimer: The Score performance whether actual or indicated by historical tests of strategies, is no guarantee of future performance or success. The results reflect performance of a strategy not historically offered to investors and does not represent returns that any investor actually attained. Active trading is generally not appropriate for someone of limited resources, limited investment or trading experience, or low-risk tolerance. Your capital may be at risk.
Please note that no offer or solicitation to buy or sell securities, securities derivatives of future products of any kind, or any type of trading or investment advice, recommendation or strategy, is made, given or endorsed by StocksRunner including any of their affiliates.
This information is provided for illustrative purposes only. You should not rely on any advice and/or information contained in this website and before making any investment decision we recommend that you consider whether it is appropriate for your situation and seek appropriate financial, taxation and legal advice.

We're recalculating data and refreshing scores to deliver smarter, faster market intel. Check back shortly.
Tons of Signals. One Clear Vision.

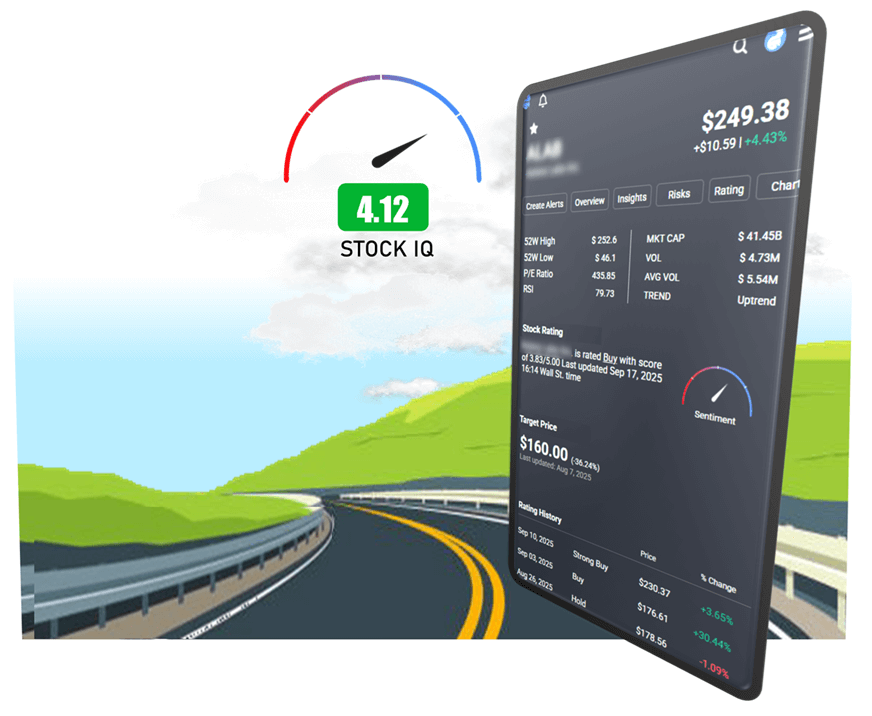
StocksRunner is an intelligence platform that transforms thousands of data sources into a single Stock IQ (1-5) for every stock, helping traders cut through market noise and make profitable decisions faster
We analyzes thousands of validated data points including market sentiment, analyst opinions, financial performance, technical indicators, and industry trends, measures how these factors historically impact stock prices over X day windows to generate a predictive Stock IQ from 1-5
Real-time price movement patterns, volume trends, and technical indicators combined with market psychology metrics
Trading volume analysis, institutional flows, and market participation data to gauge genuine interest levels
Aggregation and weighting of analyst recommendations, with bias correction and track record analysis
Forward-looking analysis combining industry trends, competitive positioning, and innovation metrics
Intelligence beyond opinion.
StocksRunner.com your trusted companion for smarter stock market decisions.
Find us on
Disclaimer: The Score performance whether actual or indicated by historical tests of strategies, is no guarantee of future performance or success. The results reflect performance of a strategy not historically offered to investors and does not represent returns that any investor actually attained. Active trading is generally not appropriate for someone of limited resources, limited investment or trading experience, or low-risk tolerance. Your capital may be at risk.
Please note that no offer or solicitation to buy or sell securities, securities derivatives of future products of any kind, or any type of trading or investment advice, recommendation or strategy, is made, given or endorsed by StocksRunner including any of their affiliates.
This information is provided for illustrative purposes only. You should not rely on any advice and/or information contained in this website and before making any investment decision we recommend that you consider whether it is appropriate for your situation and seek appropriate financial, taxation and legal advice.